ABC classification
The ABC classification pattern classifies entities based on values, grouping entities together that contribute to a certain percentage of the total. A typical example of ABC classification is the segmentation of products (entity) based on sales (value). The best-selling products that contribute to up to 70% of the total sales belong to cluster A. The products making up the next 20% of sales are in cluster B, whereas the products representing the last 10% of sales, belong to class C. Hence, the pattern is named after the three clusters (ABC).
You can use this pattern to determine the core business of a company, typically in terms of best performing products or best customers. You can find more information on ABC classification at http://en.wikipedia.org/wiki/ABC_analysis.
ABC classification can be either static or dynamic. Static ABC classification assigns a class to each product statically, so that the class of a product does not change depending on the filters being applied to the report. Dynamic ABC classification computes the class of each product dynamically, based on the report filters. As such, in the dynamic ABC classification the clustering of product needs to be done in measures, resulting in a less efficient – albeit more flexible – algorithm.
There is also a third pattern for this type of clustering, which lies in-between the static and the dynamic versions: the snapshot ABC. For example, if one needs to update the ABC class to a product on a yearly basis, they can accomplish this by creating a snapshot table containing the ABC class of a product for every year.
Static ABC classification
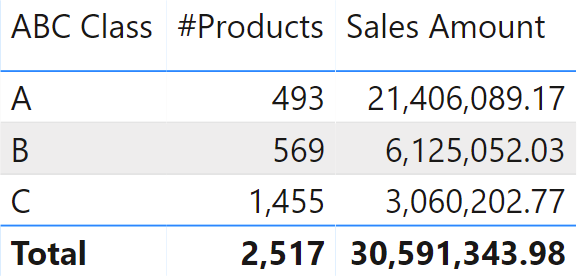
In the example, we cluster products based on sales. Each product is statically assigned to a class that can be used on the rows and columns of a report. The report in Figure 1 shows that there are 493 products in class A, making over 21M in sales, whereas 1,455 products in class C only generate 3M in sales.
The static ABC classification is based on calculated columns. You need four new calculated columns, as shown in Figure 2.

The four calculated columns are:
- Product Sales: the total sales for the product (current row).
- Cumulated Sales: the running total of Product Sales ranked from largest to smallest.
- Cumulated Pct: the percentage of Cumulated Sales against the grand total of sales.
- ABC Class: the class of the product, which could be A, B, or C.
You define the calculated columns using the following DAX formulas:
Product Sales =
[Sales Amount]
Cumulated Sales =
VAR CurrentProductSales = 'Product'[Product Sales]
VAR BetterProducts =
    FILTER (
        'Product',
        'Product'[Product Sales] >= CurrentProductSales
    )
VAR Result =
    SUMX (
        BetterProducts,
        'Product'[Product Sales]
    )
RETURN
    Result
Cumulated Pct =
DIVIDE (
    'Product'[Cumulated Sales],
    SUM ( 'Product'[Product Sales] )
)
ABC Class =
SWITCH (
    TRUE,
    'Product'[Cumulated Pct] <= 0.7, "A",
    'Product'[Cumulated Pct] <= 0.9, "B",
    "C"
)
The product class is determined by the value of Cumulated Pct. As you can see in Figure 3, when the value is below 70% the product class is still A, when it is over 70% the product class becomes B.

The four columns can be replaced with a single calculated column containing the complete logic, using several variables:
ABC Class Optimized =
VAR SalesByProduct = ADDCOLUMNS ( 'Product', "@ProdSales", [Sales Amount] )
VAR CurrentSales = [Sales Amount]
VAR BetterProducts = FILTER ( SalesByProduct, [@ProdSales] >= CurrentSales )
VAR CumulatedSales = SUMX ( BetterProducts, [@ProdSales] )
VAR AllSales = CALCULATE ( [Sales Amount], ALL ( 'Product' ) )
VAR CumulatedPct = DIVIDE ( CumulatedSales, AllSales )
VAR AbcClass =
SWITCH (
    TRUE,
    CumulatedPct <= 0.7, "A",
    CumulatedPct <= 0.9, "B",
    "C"
)
RETURN
    AbcClass
Using this version of the code reduces the size of the model, because it creates one column in place of the four needed in the earlier version. Nevertheless, on databases with a large number of products, the column calculation might require an excessive amount of memory.
Snapshot ABC classification
You might need to assign the ABC class to each product on a yearly basis, so that the same product can fall into different ABC classes in different years. In this case, you should build a solution with an additional snapshot table containing the correct ABC class for each product and year. The goal is to produce a report like the one in Figure 4 – showing for each year, the number of products that fell in class A, B or C.

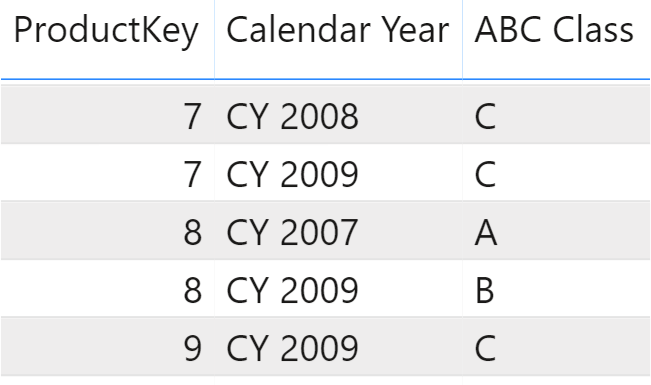
The model requires an additional table to store the ABC class for each year and product. The ABC by Year table does not have relationships with other tables in the model and it contains the product key, the year, and the assigned class, as shown in Figure 5.
The code that computes the table is the following:
ABC by Year =
VAR ProductsByYear =
    SUMMARIZE (
        Sales,
        'Product'[ProductKey],
        'Date'[Calendar Year]
    )
VAR SaleByYearProduct =
    ADDCOLUMNS (
        ProductsByYear,
        "@ProdSales", [Sales Amount],
        "@YearlySales", CALCULATE (
            [Sales Amount],
            ALL ( 'Product' )
        )
    )
VAR CumulatedSalesByYearProduct =
    ADDCOLUMNS (
        SaleByYearProduct,
        "@CumulatedSales",
        VAR CurrentSales = [@ProdSales]
        VAR CurrentYear = 'Date'[Calendar Year]
        VAR CumulatedSalesWithinYear =
            FILTER (
                SaleByYearProduct,
                AND (
                    'Date'[Calendar Year] = CurrentYear,
                    [@ProdSales] >= CurrentSales
                )
            )
        RETURN
            SUMX (
                CumulatedSalesWithinYear,
                [@ProdSales]
            )
    )
VAR CumulatedPctByYearProduct =
    ADDCOLUMNS (
        CumulatedSalesByYearProduct,
        "@CumulatedPct", DIVIDE (
            [@CumulatedSales],
            [@YearlySales]
        )
    )
VAR ClassByYearProduct =
    ADDCOLUMNS (
        CumulatedPctByYearProduct,
        "@AbcClass", SWITCH (
            TRUE,
            [@CumulatedPct] <= 0.7, "A",
            [@CumulatedPct] <= 0.9, "B",
            "C"
        )
    )
VAR Result =
    SELECTCOLUMNS (
        ClassByYearProduct,
        "ProductKey", 'Product'[ProductKey],
        "Calendar Year", 'Date'[Calendar Year],
        "ABC Class", [@AbcClass]
    )
RETURN
    Result
The result of this code is the final one, shown in Figure 5. It helps to visualize the content of the ClassByYearProduct variable, which shows the columns added to the intermediate calculation through several steps. You can see this in Figure 6.

Once the table is loaded in the model, the ABC by Year table can be used as a filter remapping the data lineage of ProductKey and Calendar Year to the corresponding columns in the Product and Date tables. For example, the report shown at the beginning of the section uses these two measures:
# Products :=
VAR RemapFilterAbc =
    TREATAS (
        'ABC by Year',            -- Remap the columns of ABC by Year
        'Product'[ProductKey],    -- so that only the specific
        'Date'[Calendar Year],    -- combinations of product and year
        'ABC by Year'[ABC Class]  -- are included in the filter context
    )
VAR Result =
    CALCULATE (
        DISTINCTCOUNT ( Sales[ProductKey] ),
        KEEPFILTERS ( RemapFilterAbc )
    )
RETURN
    Result
ABC Sales Amount :=
VAR RemapFilterAbc =
    TREATAS (
        'ABC by Year',            -- Remap the columns of ABC by Year
        'Product'[ProductKey],    -- so that only the specific
        'Date'[Calendar Year],    -- combinations of product and year
        'ABC by Year'[ABC Class]  -- are included in the filter context
    )
VAR Result =
    CALCULATE (
        [Sales Amount],
        KEEPFILTERS ( RemapFilterAbc )
    )
RETURN
    Result
By using TREATAS both measures move the filter from the snapshot to the Product and the Date tables, obtaining the desired result. It is important to apply ProductKey and Calendar Year in the same filter, otherwise the measure could include combinations of products and years that are not included in the selected ABC classes.
There is an alternative solution that works better in models with a larger number of products – by using expanded tables. As you can see in Figure 7, this requires an intermediate Years table linked to Date through a relationship with a bidirectional filter (so it is not available in the Excel Power Pivot sample).
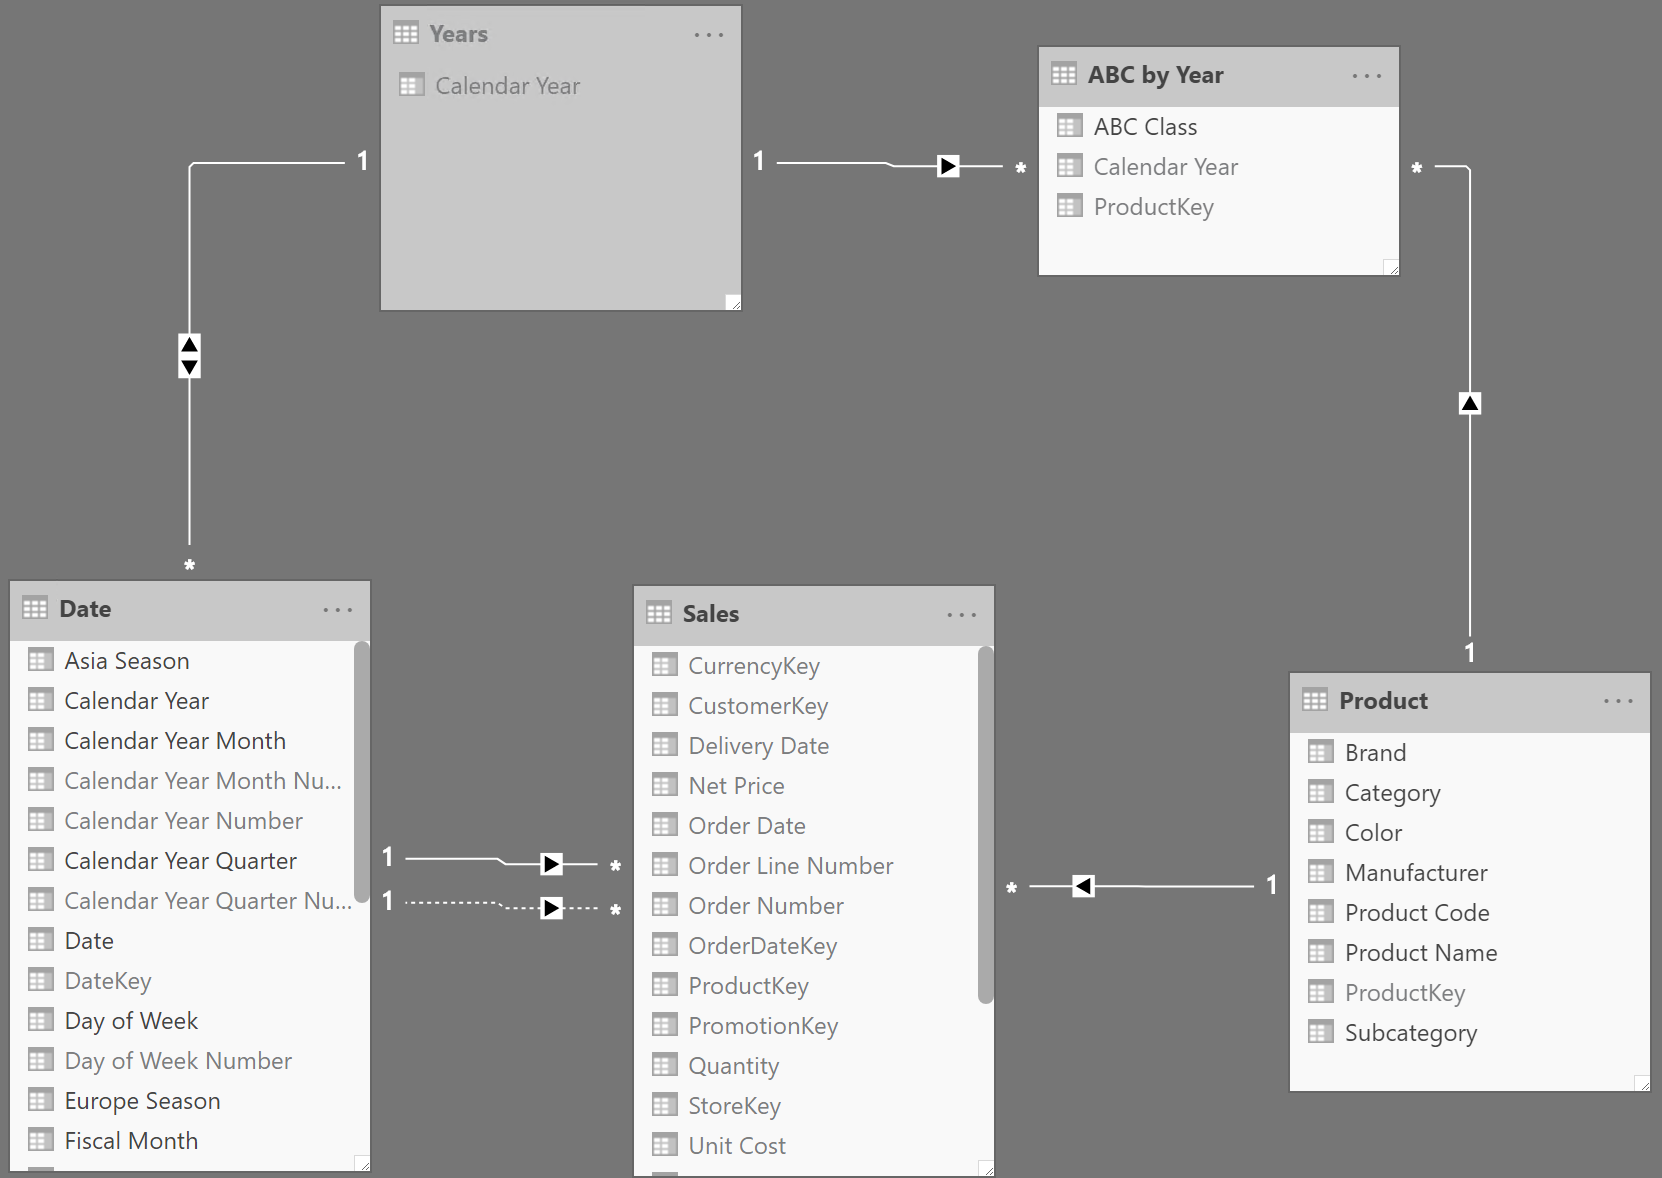
The Years table is easily computed using a DISTINCT function:
Years = DISTINCT ( 'Date'[Calendar Year] )
The measures are simpler – though harder to understand – because they rely on table expansion:
# Products Opt :=
CALCULATE (
    DISTINCTCOUNT ( Sales[ProductKey] ),
    'ABC by Year'
)
ABC Sales Amount Opt :=
CALCULATE (
    [Sales Amount],
    'ABC by Year'
)
The snapshot ABC classification is more dynamic than the static version. The calculated table requires some computational effort. Nevertheless, it is computed at data refresh time and it is very quick at query time. Therefore, the snapshot ABC classification is a very good compromise between speed and flexibility. If flexibility is the main goal, then the slower dynamic ABC classification pattern is a better fit.
Dynamic ABC classification
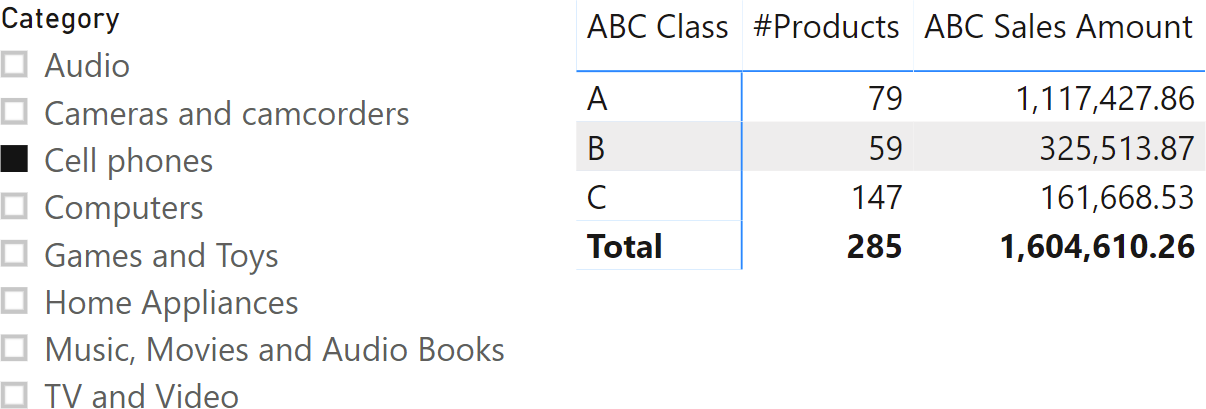
The dynamic ABC pattern is the most flexible of the three patterns presented, and consequently it is the slowest and most memory-hungry. The goal is to dynamically compute the number of products, the sales amount or any other measure determining the set of products that belong to the given ABC class in the context of the report. For example, in Figure 8 the classes are determined considering only the Cell phones category; when the user selects a different category, the whole report is computed with the new filters.
Being dynamic, the whole logic is defined in a measure that retrieves the list of products in the desired class, and then uses this list as a filter over the required calculation. Moreover, from the model point of view, there is the need to create an additional ABC Classes table that contains the three classes with their boundaries. This is shown in Figure 9.

The measure that computes the ABC Sales Amount is the following:
ABC Sales Amount :=
VAR SalesByProduct =
    CALCULATETABLE (
        ADDCOLUMNS (
            SUMMARIZE ( Sales, 'Product'[ProductKey] ),
            "@ProdSales", [Sales Amount]
        ),
        ALLSELECTED ( 'Product' )
    )
VAR AllSales =
    CALCULATE (
        [Sales Amount],
        ALLSELECTED ( 'Product' )
    )
VAR CumulatedPctByProduct =
    ADDCOLUMNS (
        SalesByProduct,
        "@CumulatedPct",
        VAR CurrentSalesAmt = [@ProdSales]
        VAR CumulatedSales =
            FILTER (
                SalesByProduct,
                [@ProdSales] >= CurrentSalesAmt
            )
        VAR CumulatedSalesAmount =
            SUMX (
                CumulatedSales,
                [@ProdSales]
            )
        VAR Perc =
            DIVIDE (
                CumulatedSalesAmount,
                AllSales
            )
        RETURN
            MIN ( Perc, 1 ) -- Avoid >100% in case of rounding issues
    )
VAR ProductsInClass =
    FILTER (
        CROSSJOIN (
            CumulatedPctByProduct,
            'ABC Classes'
        ),
        AND (
            [@CumulatedPct] > 'ABC Classes'[Lower Boundary],
            [@CumulatedPct] <= 'ABC Classes'[Upper Boundary]
        )
    )
VAR Result =
    CALCULATE (             -- The pattern is the same for every measure, just
        [Sales Amount],     -- change this measure reference for other measures
        KEEPFILTERS ( ProductsInClass )
    )
RETURN
    Result
The complexity of the formula mainly depends on the number of products – the larger the number of products, the slower and more memory-intensive it becomes. Over around ten thousand products, the code will likely start to be too slow to produce an interactive report. This defeats the initial purpose of obtaining a dynamic report.
Finding the ABC class
This pattern describes how to find the ABC class of a product dynamically, producing the result in a measure instead of using a column to classify an existing item. Other ABC segmentation patterns aim to split products into different classes and compute a value, like the sales amount or the number of products. This pattern is useful when you need to show the ABC class of a product dynamically, producing a report like Figure 10: The report shows for each product of the Computers category, its ABC class in 2008.
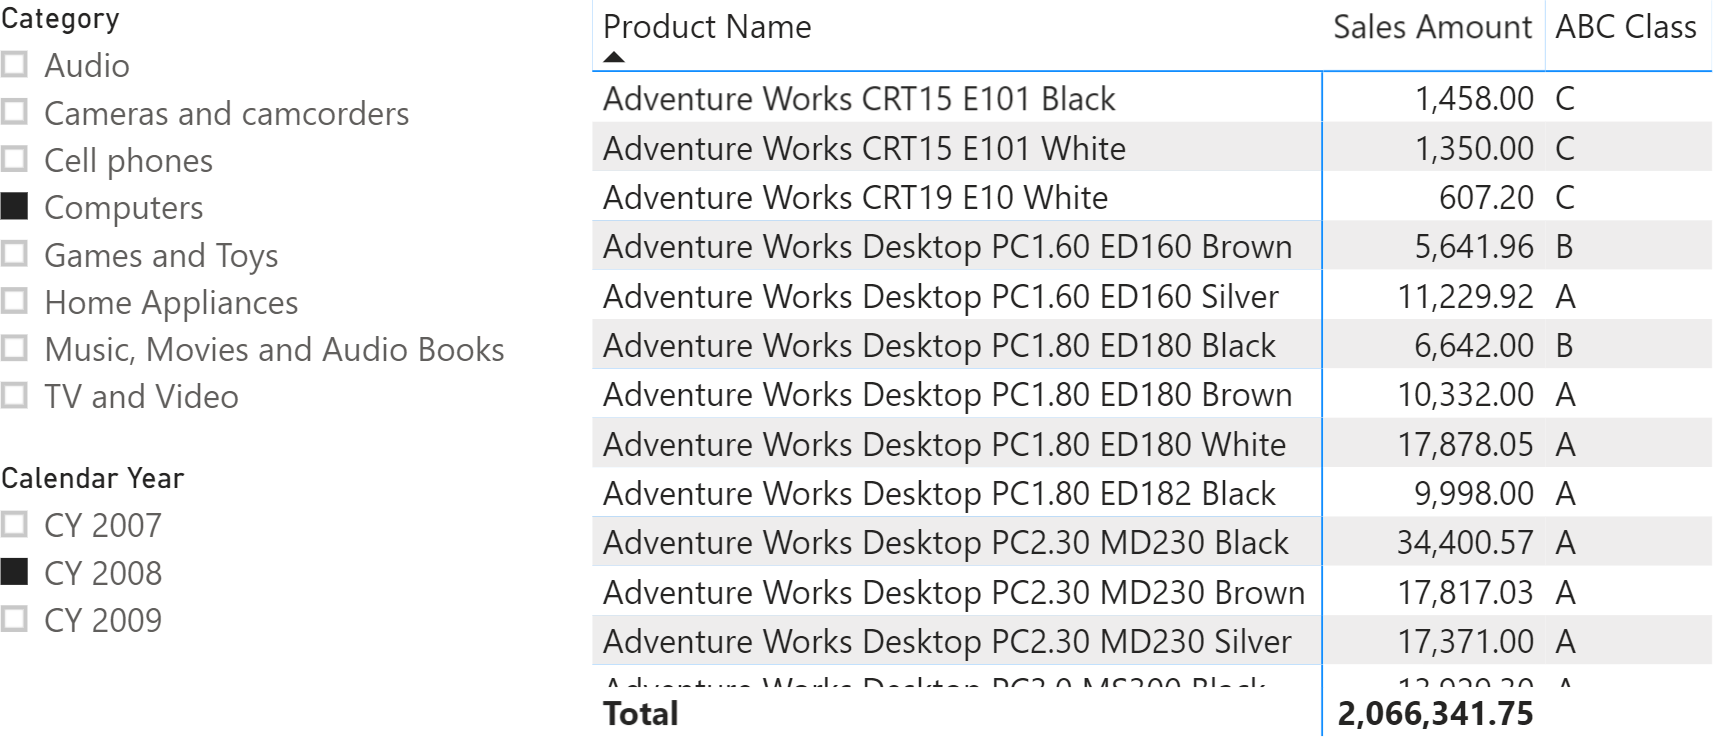
The measure that computes the ABC class is a variation of the dynamic ABC classification. This time, the measure does not need to compute the ABC class of all the products – it is enough to compute the ABC class of the selected product. Therefore, once it computes the list of all products along with their sales, the measure uses the information to compute the correct values only for the current product:
ABC Class :=
IF (
    HASONEVALUE ( 'Product'[ProductKey] ),
    VAR SalesByProduct =
        CALCULATETABLE (
            ADDCOLUMNS (
                SUMMARIZE ( Sales, 'Product'[ProductKey] ),
                "@ProdSales", [Sales Amount]
            ),
            ALLSELECTED ( 'Product' )
        )
    VAR AllSales =
        CALCULATE (
            [Sales Amount],
            ALLSELECTED ( 'Product' )
        )
    VAR CurrentSalesAmt = [Sales Amount]
    VAR CumulatedSales =
        FILTER (
            SalesByProduct,
            [@ProdSales] >= CurrentSalesAmt
        )
    VAR CumulatedSalesAmount =
        SUMX (
            CumulatedSales,
            [@ProdSales]
        )
    VAR CurrentCumulatedPct =
        DIVIDE (
            CumulatedSalesAmount,
            AllSales
        )
    VAR Result =
        SWITCH (
            TRUE,
            ISBLANK ( CurrentCumulatedPct ), BLANK (),
            CurrentCumulatedPct <= 0.7, "A",
            CurrentCumulatedPct <= 0.9, "B",
            "C"
        )
    RETURN
        Result
)
UPDATE 2022-08-19: We applied small changes to Dynamic ABC classification and Finding the ABC class formulas to improve the result and the performance when many products have no sales or a very low amount of sales. You can spot small differences between the formulas shown in the video and those in sample files and the article, but the principle of the calculation does not change because of that.
Treats the columns of the input table as columns from other tables. For each column, filters out any values that are not present in its respective output column.
TREATAS ( <Expression>, <ColumnName> [, <ColumnName> [, … ] ] )
Returns a one column table that contains the distinct (unique) values in a column, for a column argument. Or multiple columns with distinct (unique) combination of values, for a table expression argument.
DISTINCT ( <ColumnNameOrTableExpr> )
This pattern is designed for Power BI / Excel 2016-2019. An alternative version for Excel 2010-2013 is also available.
This pattern is included in the book DAX Patterns, Second Edition.
Video
Do you prefer a video?
This pattern is also available in video format. Take a peek at the preview, then unlock access to the full-length video on SQLBI.com.Watch the full video — 43 min.
Downloads
Download the sample files for Power BI / Excel 2016-2019:

