ABC Classification
The ABC Classification pattern is a specialization of the Static Segmentation pattern that implements the ABC analysis in DAX, which is also known as ABC/Pareto analysis, because it is based on the Pareto principle. The resulting ABC class is calculated at process time, so it is static and uses calculated columns to store the result of classification. You can use this pattern to determine the core business of a company, typically in terms of best products or best customers. You can find more information on ABC analysis on http://en.wikipedia.org/wiki/ABC_analysis.
Basic Pattern Example
Suppose you want to analyze the importance of products for the revenues of your company using ABC analysis. You have to assign each product to a class (A, B, or C) for which the following is true:
- Products in class A account for 70 percent of the revenues.
- Products in class B account for 20 percent of the revenues.
- Products in class C account for the remaining 10 percent of the revenues.
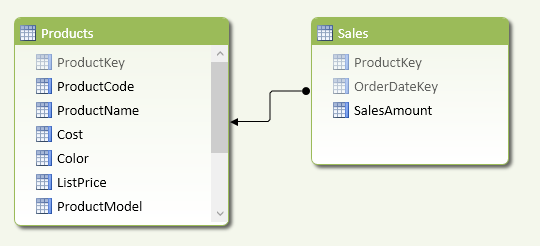
In the Products table, you create a calculated column that contains the ABC class to use as a grouping attribute in reports. The Products table has a relationship with the Sales table.

To implement ABC classification, you then create a few more calculated columns in the Products table. All of these columns except ABC Class will be hidden from the client tools:
- ProductSales: the total of sales for the product (current row).
- CumulatedSales: the total of sales for all the products that sold more than or the same total sales of the product (current row).
- CumulatedPercentage: the RunningTotalSales value represented as a percentage of the grand total of sales.
- ABC Class: the class of the product, which could be A, B, or C.
You define the calculated columns using the following DAX formulas:
[ProductSales] =
CALCULATE ( SUM ( Sales[SalesAmount] ) )

[CumulatedSales] =
CALCULATE (
    SUM ( Products[ProductSales] ),
    ALL ( Products ),
    Products[ProductSales] >= EARLIER ( Products[ProductSales] )
)

[CumulatedPercentage] =
Products[CumulatedSales] / SUM ( Products[ProductSales] )

[ABC Class] =
SWITCH (
    TRUE (),
    Products[CumulatedPercentage] <= 0.7, "A",
    Products[CumulatedPercentage] <= 0.9, "B",
    "C"
)

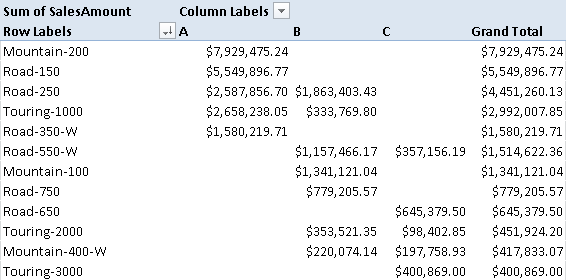
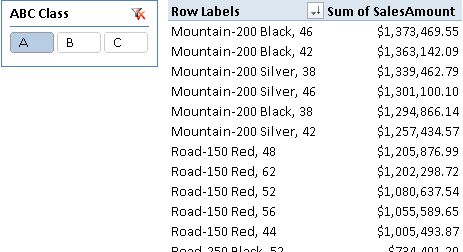
You can use the new ABC Class column as a filter in a pivot tables, as shown in Figure 10-3 and Figure 10-4.


You use the ABC classification to create a static segmentation of entities in a data model. If the entity you want to classify does not have the granularity of a table, you have to use slightly different formulas, as described in the Complete Pattern section.
Use Cases
You can use the ABC Classification pattern whenever you want to focus attention on a smaller number of elements in a set—for example, when you have to allocate limited resources in a more efficient way. The following is a small list of common use cases, but real world applications are countless.
Inventory Management
You can use ABC classification as an inventory categorization technique to help manage stock and reduce overall inventory cost. Items in class A are the most important for the business and you should analyze their value more often, whereas items in class C are less important and items in class B are in an intermediate state. For example, you might increase the stock availability and negotiate for better prices for products in class A, reducing time and resources for items in classes B and C.
The measure used as a target for ABC classification in inventory management might include multiple criteria that consider volume (sales amount), profitability (contribution margin on inventory investment), and velocity (number of times an item is ordered).
Customer Segmentation
You can use ABC classification of customers to calibrate resources allocated for sales and marketing, such as investment on customer retention policies, prioritization of technical support calls, assignment of dedicated account managers, and so on. The measures used as a target for classification are usually revenue and margin.
Marketing Segmentation
You might use ABC classification to segment products for allocating marketing budget used to promote and push product sales. The measures used as a target for classification are usually revenue and margin, whereas the item considered can be the SKU of the product or a group of features (e.g., category, model, color, and so on).
Complete Pattern
You calculate the ABC classification for an entity with the following template, using these markers:
- <granularity_table> is the table that defines the subdivision level of the entities you want to classify. For example, it could be the Products table if you want to classify products.
- <granularity_attribute> is an attribute you want to use as a classification target (something that groups entities into a smaller number of elements). For example, it could be
Products[ProductModel], the ProductModel column of the Products table. - <measure> is the value to compute for each entity <granularity_table> for ABC classification.
[EntityMeasure] =
CALCULATE ( <measure> )

[CumulatedPercentage] =
CALCULATE (
    <measure>,
    ALL ( <granularity_table> ),
    <granularity_table>[EntityMeasure]
        >= EARLIER ( <granularity_table>[EntityMeasure] )
)
    / CALCULATE ( <measure>, ALL ( <granularity_table> ) )

[ABC Class] =
SWITCH (
    TRUE (),
    <granularity_table>[CumulatedPercentage] <= 0.7, "A",
    <granularity_table>[CumulatedPercentage] <= 0.9, "B",
    "C"
)
For example, you would implement the ABC Product calculated column in a model with Products and Sales tables as follows:
[ProductSales] =
CALCULATE ( [Sales Amount] )

[ProductPercentage] =
CALCULATE (
    [Sales Amount],
    ALL ( Products ),
    Products[ProductSales] >= EARLIER ( Products[ProductSales] )
)
    / CALCULATE ( [Sales Amount], ALL ( Products ) )

[ABC Product] =
SWITCH (
    TRUE (),
    Products[ProductPercentage] <= 0.7, "A",
    Products[ProductPercentage] <= 0.9, "B",
    "C"
)

If you want to calculate the ABC classification for an attribute of the entity, you use a slightly different template only for the EntityMeasure calculated column:
[EntityMeasure] =
CALCULATE (
    <measure>,
    ALL ( <granularity_table> ),
    <granularity_table>[<granularity_attribute>]
        = EARLIER( <granularity_table>[<granularity_attribute>] )
)
For example, you implement the ABC Model calculated column in the same model with Products and Sales tables as follows:
[ModelSales] =
CALCULATE (
    [Sales Amount],
    ALL ( Products ),
    Products[ProductModel] = EARLIER ( Products[ProductModel] )
)

[ModelPercentage] =
CALCULATE (
    [Sales Amount],
    ALL ( Products ),
    Products[ModelSales] >= EARLIER ( Products[ModelSales] )
)
    / CALCULATE ( [Sales Amount], ALL ( Products ) )

[ABC Model] =
SWITCH (
    TRUE (),
    Products[ModelPercentage] <= 0.7, "A",
    Products[ModelPercentage] <= 0.9, "B",
    "C"
)
All the products belonging to the same model share the same ABC Model classification.

To use ABC classification on a single denormalized table, you must slightly change the EntityMeasure definition as follows:
[EntityMeasure] =
CALCULATE (
    <measure>,
    ALLEXCEPT ( <granularity_table>, <granularity_table>[<granularity_attribute>] )
)
For example, you would implement ABC Product and ABC Model calculated columns in a model with a single denormalized Sales table as follows:
[ProductSales] =
CALCULATE (
    [Sales Amount],
    ALLEXCEPT ( Sales, Sales[Product] )
)

[ProductPercentage] =
CALCULATE (
    [Sales Amount],
    ALL ( Sales ),
    Sales[ProductSales]
        >= EARLIER ( Sales[ProductSales] )
)
    / CALCULATE ( [Sales Amount], ALL ( Sales ) )

[ABC Product] =
SWITCH (
    TRUE,
    Sales[ProductPercentage] <= 0.7, "A",
    Sales[ProductPercentage] <= 0.9, "B",
    "C"
)

[ModelSales] =
CALCULATE (
    [Sales Amount],
    ALLEXCEPT ( Sales, Sales[Model] )
)

[ModelPercentage] =
CALCULATE (
    [Sales Amount],
    ALL ( Sales ),
    Sales[ModelSales]
        >= EARLIER ( Sales[ModelSales] )
)
    / CALCULATE ( [Sales Amount], ALL ( Sales ) )

[ABC Model] =
SWITCH (
    TRUE (),
    Products[ModelPercentage] <= 0.7, "A",
    Products[ModelPercentage] <= 0.9, "B",
    "C"
)


This pattern is designed for Excel 2010-2013. An alternative version for Power BI / Excel 2016-2019 is also available.
This pattern is included in the book DAX Patterns 2015.
Downloads
Download the sample files for Excel 2010-2013:

