Cumulative total
The cumulative total pattern allows you to perform calculations such as running totals. You can use it to implement warehouse stock and balance sheet calculations using the original transactions instead of using snapshots of data over time.
For example, in order to create an Inventory table that shows the stock of each product for every month, you can make that calculation by using the original warehouse movements table, without processing and consolidating data in advance.
The most frequent case of running total is the sum of all the transactions made before a given date. But that same calculation can be used in any scenario where you accumulate values over any sortable column. This is shown in one of the examples of this pattern.
Basic scenario
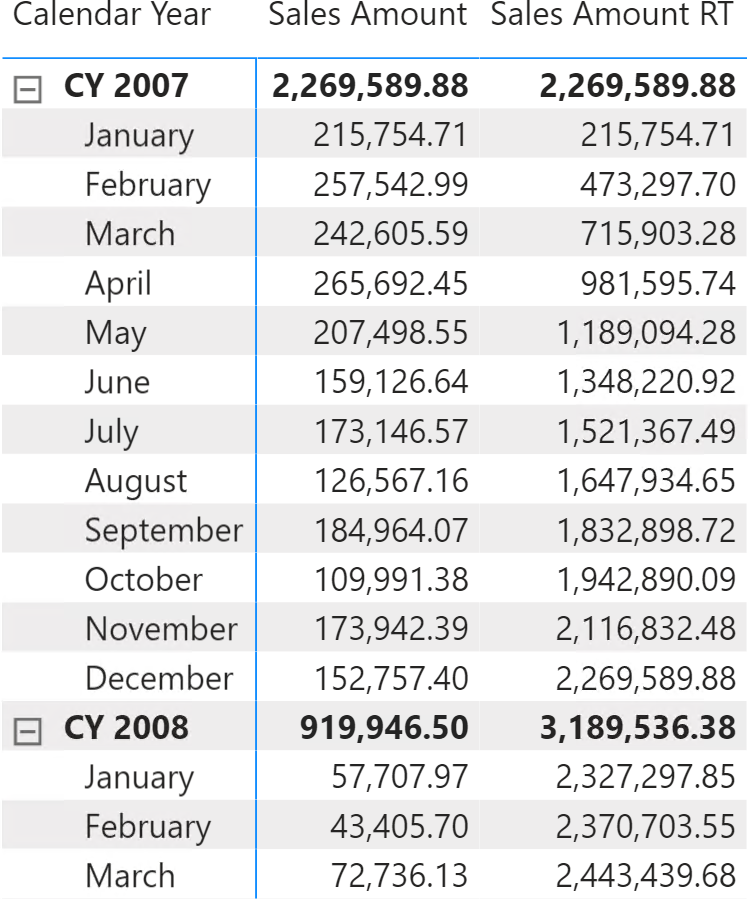
We want to create a measure that sums all the sales values up to a certain date. The result should look like what we show in Figure 1.

The formula must compute the value of Sales Amount for all the dates which are less than or equal to the last one visible in the current filter context. The code also performs an additional check to avoid showing values for future dates – that is, when the minimum visible date is greater than the last date with sales:
Sales Amount RT :=
VAR LastVisibleDate =
    MAX ( 'Date'[Date] )
VAR FirstVisibleDate =
    MIN ( 'Date'[Date] )
VAR LastDateWithSales =
    CALCULATE (
        MAX ( 'Sales'[Order Date] ),
        REMOVEFILTERS ()   -- Use ALL ( Sales ) if REMOVEFILTERS () and ALL ()
                           -- are not available
    )
VAR Result =
    IF (
        FirstVisibleDate <= LastDateWithSales,
        CALCULATE (
            [Sales Amount],
            'Date'[Date] <= LastVisibleDate
        )
    )
RETURN
    Result
It is important that the Date table is marked as a date table for the formula to work. If not, it is necessary to add REMOVEFILTERS over Date as a further CALCULATE modifier, when applying the filter in the computation of the Result variable:
VAR Result =
    IF (
        FirstVisibleDate <= LastDateWithSales,
        CALCULATE (
            [Sales Amount],
            'Date'[Date] <= LastVisibleDate,
            REMOVEFILTERS ( 'Date' )
        )
    )
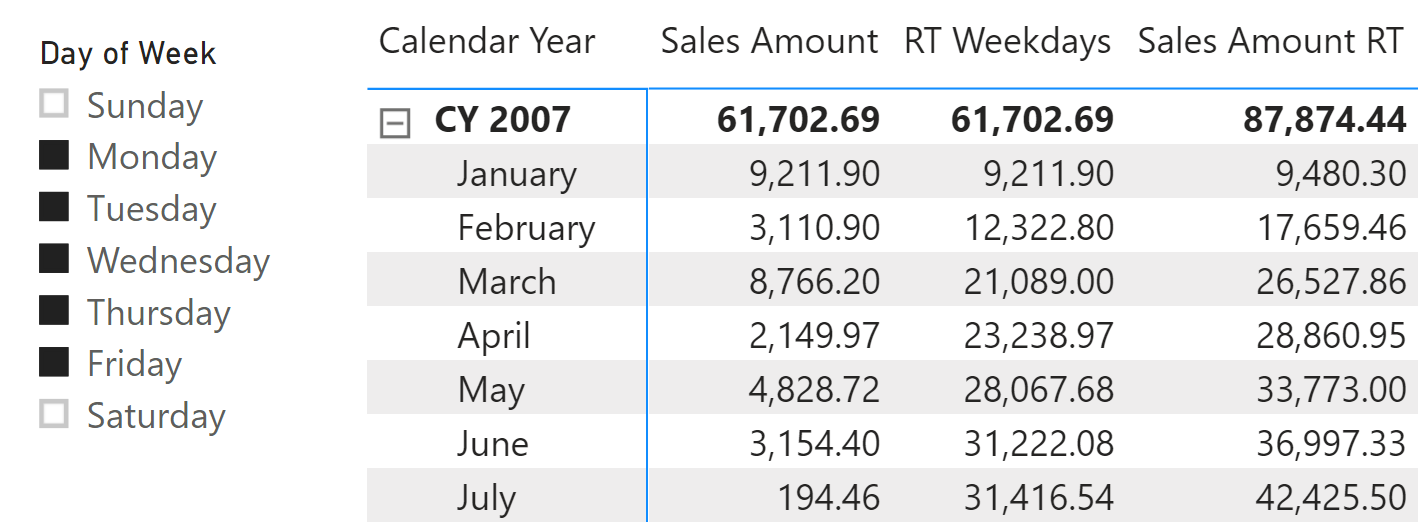
Either way, the formula of Sales Amount RT applies a filter to the Date table which removes all the previously existing filters on Date. Therefore, if you need to keep existing filters on some columns of the Date table, you must apply these filters again. For example, in order to compute the running total while keeping the filter on the day of the week, the code would be the following:
RT Weekdays :=
VAR LastVisibleDate =
    MAX ( 'Date'[Date] )
VAR FirstVisibleDate =
    MIN ( 'Date'[Date] )
VAR LastDateWithSales =
    CALCULATE (
        MAX ( 'Sales'[Order Date] ),
        REMOVEFILTERS ()
    )
VAR Result =
    IF (
        FirstVisibleDate <= LastDateWithSales,
        CALCULATE (
            [Sales Amount],
            'Date'[Date] <= LastVisibleDate,
            VALUES ( 'Date'[Day of Week] )
        )
    )
RETURN
    Result
Figure 2 shows the two measures RT Weekdays and Sales Amount RT running totals behaving differently, with and without the additional filter on the days of the week.

Cumulative total on columns that can be sorted
Most commonly, the cumulative total pattern tends to be based on the date. That said, that pattern can be adapted to any column that can be sorted. The option for a column to be sorted is important because the code includes a “less than or equal to” condition to work properly.
As an example, we classify customers based on sales volumes, according to the table in Figure 3.

We want to produce a report that shows the sales amount of each class along with the running total of sales by customer class, as you can see in Figure 4.

The code requires us to pay special attention to the Sort by Column. Indeed, because the column shown in the report is Customer[Customer Class] and ordering is achieved by Customer[Customer Class Number], the calculation must override the filters on both columns even though the entire calculation is only based on the class number:
Sales Amount RT Class :=
VAR LastVisibleClass =
    MAX ( Customer[Customer Class Number] )
VAR ClassesToSum =
    FILTER (
        ALLSELECTED (
            Customer[Customer Class],
            Customer[Customer Class Number]
        ),
        Customer[Customer Class Number] <= LastVisibleClass
    )
VAR Result =
    CALCULATE (
        [Sales Amount],
        ClassesToSum
    )
RETURN
    Result
The ALLSELECTED function used in order to evaluate the ClassesToSum variable only takes into account the classes visible in the visual for the running total calculation. In case Sort by Column is not being used, the ALLSELECTED can include the single column to filter.
Clear filters from the specified tables or columns.
REMOVEFILTERS ( [<TableNameOrColumnName>] [, <ColumnName> [, <ColumnName> [, … ] ] ] )
Evaluates an expression in a context modified by filters.
CALCULATE ( <Expression> [, <Filter> [, <Filter> [, … ] ] ] )
Returns all the rows in a table, or all the values in a column, ignoring any filters that might have been applied inside the query, but keeping filters that come from outside.
ALLSELECTED ( [<TableNameOrColumnName>] [, <ColumnName> [, <ColumnName> [, … ] ] ] )
This pattern is designed for Power BI / Excel 2016-2019. An alternative version for Excel 2010-2013 is also available.
This pattern is included in the book DAX Patterns, Second Edition.
Video

Do you prefer a video?
This pattern is also available in video format. Take a peek at the preview, then unlock access to the full-length video on SQLBI.com.Watch the full video — 10 min.
Downloads
Download the sample files for Power BI / Excel 2016-2019:

